Essential BI Tools to Accelerate Your Business Intelligence Platforms
Business intelligence platforms allow you to make informed decisions, but the right BI tools are key. Explore these nine essential tools that will work with any business intelligence platform.
Leveraging business intelligence (BI) tools to access, analyze and report on timely data can bring huge financial returns for businesses. With all the different BI solutions on the market, it’s important to find the right tool for your organization so that you can make informed decisions. Here are nine essential BI tools that will help any business get the most out of a business intelligence platform.
Database Descriptive Statistics
Database descriptive statistics (DDS) helps you understand the structure and properties of your organization’s data. This includes functions such as minimums, maximums, averages, medians, and standard deviations for each field. DDS provides an ideal way to quickly explore how different variables in your database interact with one another. By running descriptive statistics on different fields, you can gain insights into relationships and identify anomalies.
In-Depth
Descriptive statistics are used to summarize and describe the characteristics of a data set. They provide simple summaries about the sample and the measures. Descriptive statistics consists of three basic categories of measures: measures of central tendency, measures of variability (or spread), and frequency distribution. Examples include mean, median, mode, range, standard deviation, variance, and frequency distribution. Descriptive statistics are important for understanding the data set as a whole and can be used to make predictions about future data sets.
Tools & Software
There are various tools available for descriptive statistics, such as scatter plot chart makers with line of best fit, mean, median and mode calculators, variance calculators, standard deviation calculators, box and whisker plots, graphical and pictorial methods (e.g. histograms and scatter plots), and geographical information systems.
There are various software tools available for descriptive statistics, such as SPSS (IBM), R (R Foundation for Statistical Computing), MATLAB (The Mathworks), Microsoft Excel, SAS (Statistical Analysis System), NCSS, SelectHub, JMP, Python and XLSTAT
Data Visualization Software
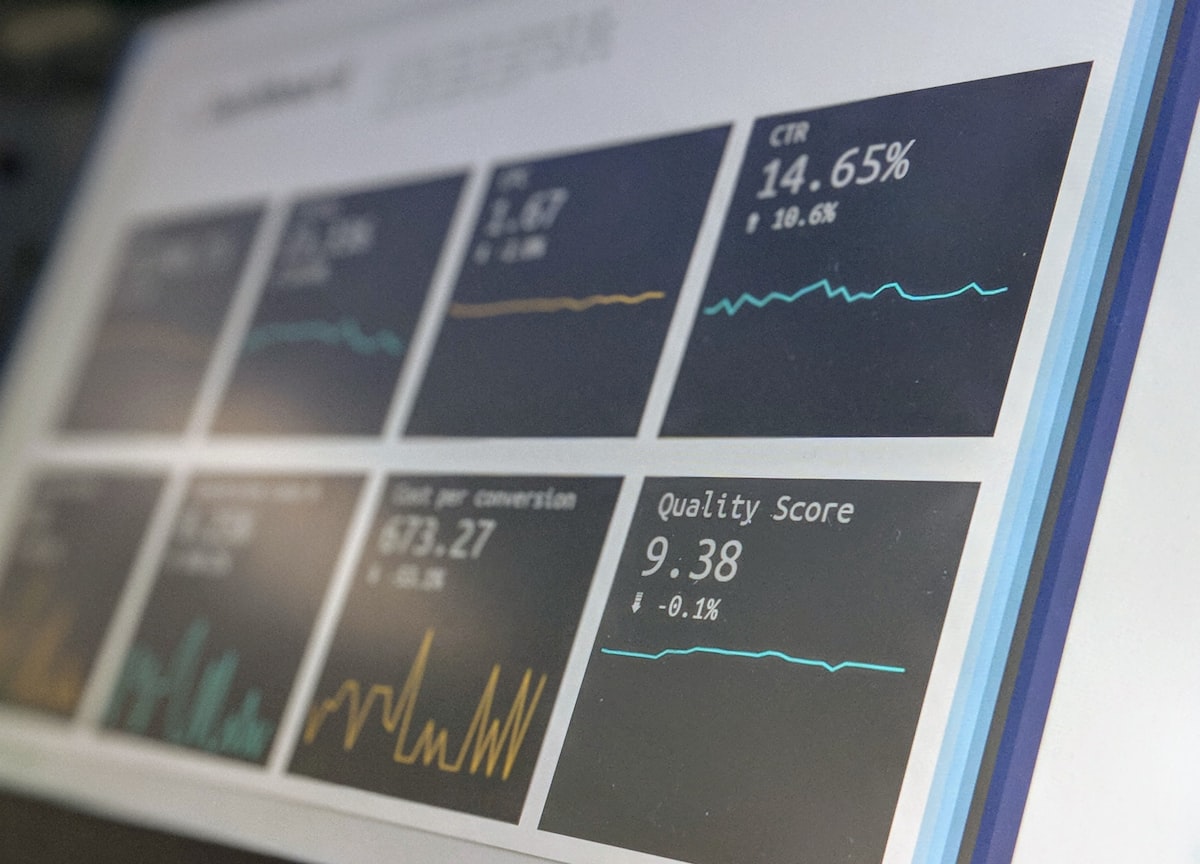
Your data visualization software is a key component of your business intelligence platform, as it's the bridge between complex sets of information and understanding. It allows you to visualize your organization’s data using customized visualizations — such as graphs and charts — revealing deeper insights into customer behavior and market trends. Data visualization helps you make sense of your data in an accessible and interactive way. With this essential BI tool, businesses can track key metrics accurately in real-time for improved decision-making.
Photo by KOBU Agency / Unsplash

Tools & Software
The best data visualization tools for 2023 include Google Charts, Tableau, Grafana, Chartist.js, FusionCharts, Datawrapper, Infogram, ChartBlocks and D3.js. Other popular options include Microsoft Excel (and Power BI), Looker, Zoho Analytics, Sisense, IBM Cognos Analytics, Qlik Sense and Domo.
Business Analytics Tool
Business analytics tools allow you to analyze your organization’s data and draw conclusions from it. You can use this type of tool to identify customer segments or specific customer behavior as well as predict future market trends. This BI tool also helps to eliminate inefficient processes in order to save cost and time while improving performance. Business analytics gives decision makers an accurate picture of the current situation,so they can make well-informed decisions that can be verified through testing with proven results.
Tools & Software
Business analytics tools are used by companies to review complex processes, algorithms, and data sets. Popular business analytics tools include Excel, SAS, Microsoft Power BI, Tableau, Qlik Sense, Splunk, MicroStrategy, Sisense, KNIME, Dundas BI and Altair, Alteryx, Amazon Web Services, AnswerRocket, BOARD, Domo and Hitachi Vantara IBM.
Dashboard Tools
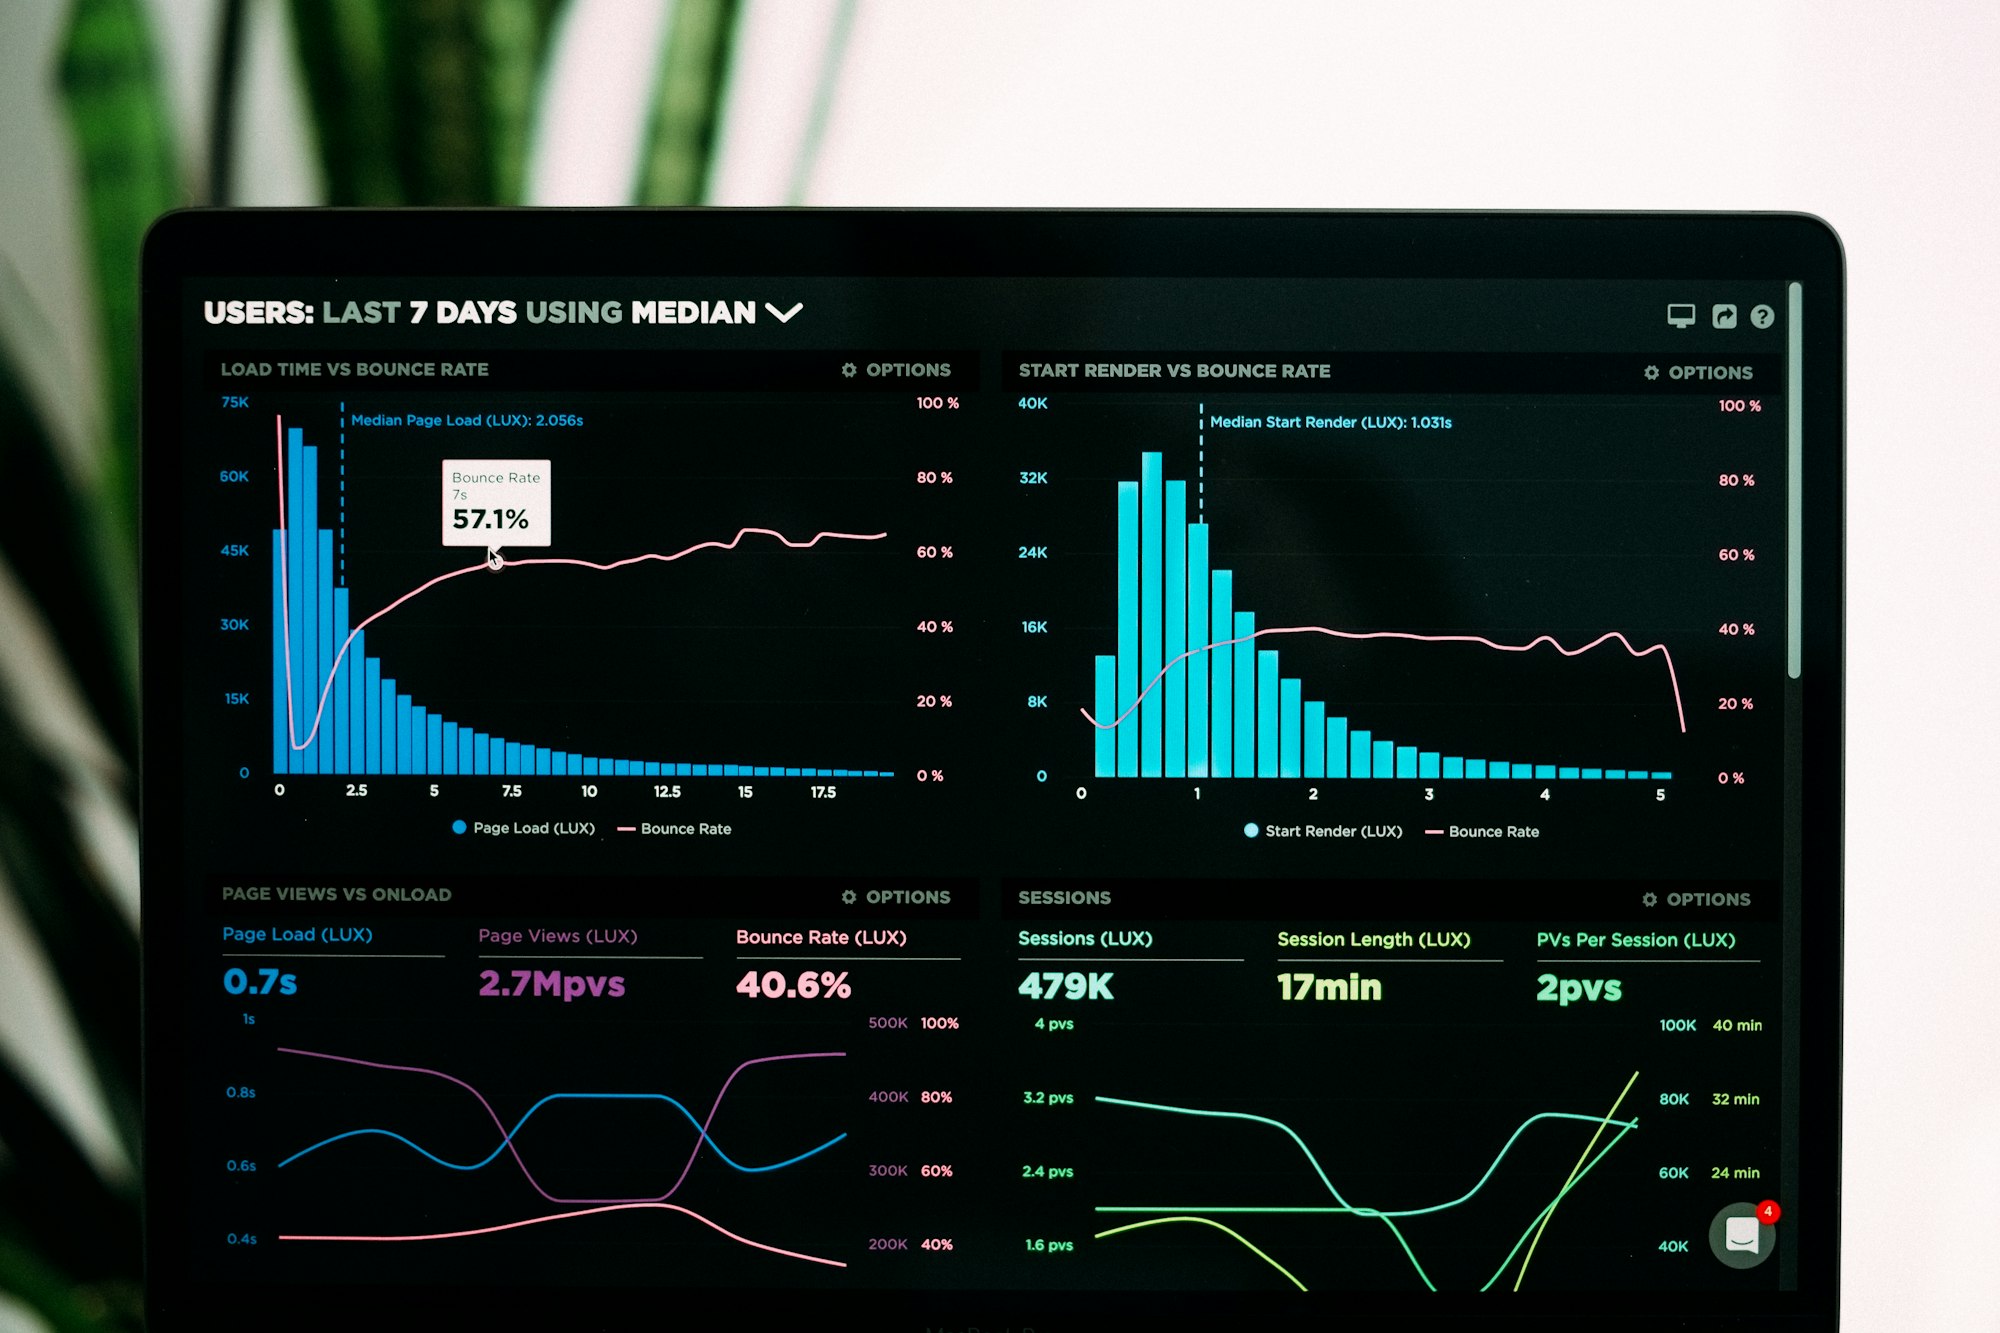
Dashboard tools are business intelligence platforms that allow users to quickly create and publish interactive, visually appealing reports and analysis.These dashboards provide real-time insight for executives and managers on the performance of the business which helps them make faster decisions. Dashboard tools provide a simple way to gain further insights from any data source with easy drill-down capabilities, powerful analytics, and custom visuals. Dashboards also offer an intuitive way to track key performance indicators (KPIs) over time to ensure short-term and long-term objectives are met.
Photo by Luke Chesser / Unsplash
Tools & Software
Dashboard software and tools provide a visual overview of organizations' data and analytics in an interactive dashboard that displays key performance metrics (KPIs). Popular dashboard solutions include Microsoft Power BI, Tableau, Domo, 7shifts, ActivTrak, Alteryx, Amity, Amperity, Ayata, Bilbeo Analytics, and free options such as Datapad, Grafana, Databox, Dasheroo, FineReport and Metabase.
Automated Reporting and Modeling Software
Automated reporting and modeling software is a key tool for BI teams. This software enables BI teams to quickly create, analyze, and publish reports, ensuring decisions are based on accurate data in real-time. Automated reporting and modeling tools also allow for easy visualization of KPIs over time, enabling users to identify opportunities for improvement and inform strategic plans. Plus, many of these automated solutions can be run on-demand or scheduled to ensure users always have the most up-to-date organization insights.
Tools & Software
Automated reporting and modeling software are tools that provide reporting, decision making, and business intelligence capabilities. Popular automated reporting tools include Google Analytics, Google Data Studio, OWOX BI, Funnel, Supermetrics, Improvado, Datorama, Zoho Analytics, Wrike and Zoho Analytics for easy-to-read charts.
Training
To become a business intelligence (BI) professional, individuals should pursue a professional certificate such as the Certified Business Intelligence Professional (CBIP). Additionally, pursuing an advanced degree such as a master's in business analytics or data science, or an MBA with a specialization in analytics can be beneficial for those looking to enter the field.
In addition to educational qualifications, individuals should also consider taking business intelligence courses and certifications to gain the necessary skills and knowledge for the role. Common steps to becoming a BI analyst include obtaining a professional certificate and pursuing an advanced degree.
Business intelligence professionals are in high demand for professions involving data, including BI analysts, BI developers, BI architects, and BI directors.
Top 9 business intelligence certifications
- Certified Business Intelligence Professional
- IBM Data Analyst Professional Certificate
- Microsoft Certified: Power BI Data Analyst Associate
- QlikView Business Analyst
- SAP Certified Application Associate: SAP BusinessObjects Business Intelligence Platform 4.3
- SAS Certified Specialist: Visual Business Analytics
- Tableau Certified Data Analyst
- Tableau Desktop Specialist
- Tableau Server Certified Associate
Photo by Glenn Carstens-Peters / Unsplash